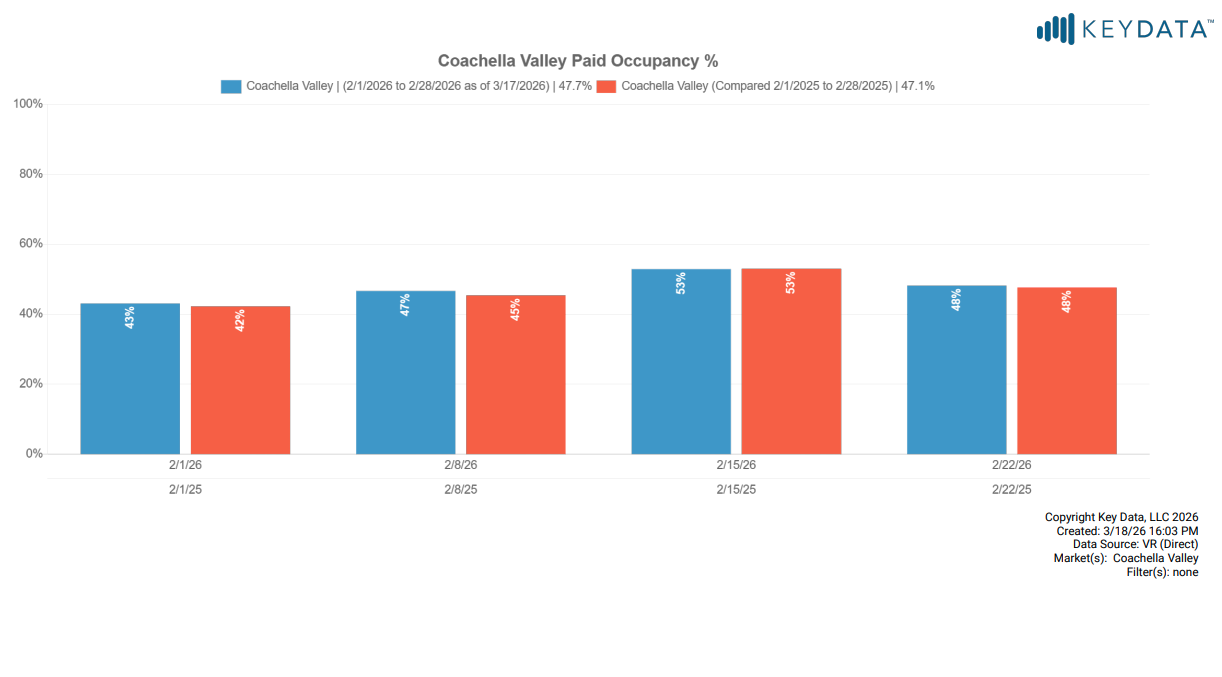
Paid Occupancy – Professionally Managed Homes
For the month of February 2026, paid guest occupancy in vacation rental homes was 47.7%, up from 47.1% in 2025.
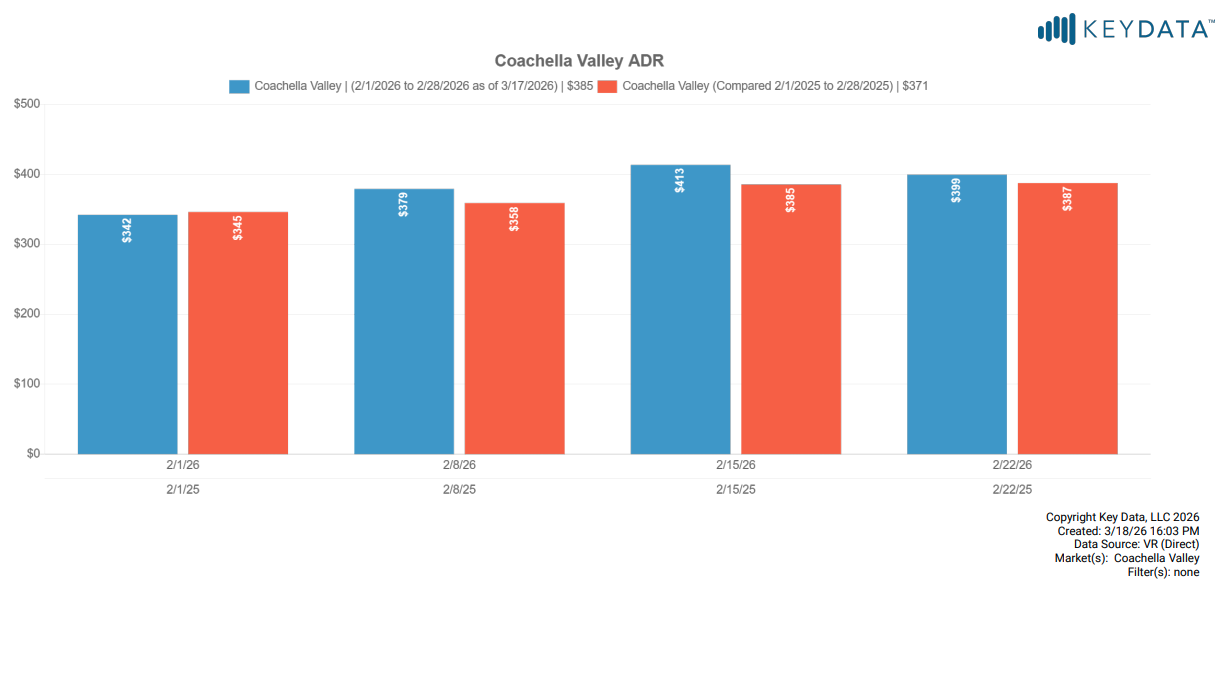
Average Daily Rate (ADR)
ADR for February 2026 was $385, up from $371 in 2025.
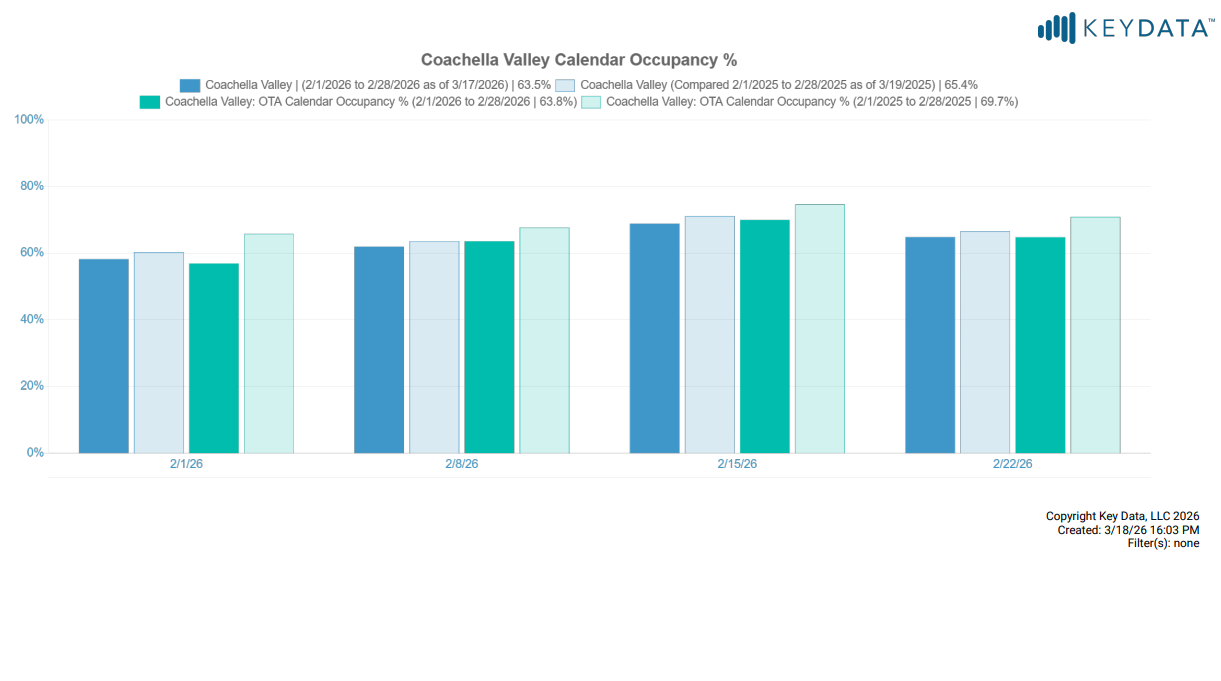
OTA Calendar Occupancy
OTA calendar occupancy was 63.8% for February 2026, compared to 69.7% in 2025. Note, the graph below also includes professionally managed “calendar occupancy” which includes dates occupied by owners, maintenance holds and other non-paid calendar blocks. OTA calendars do not indicate whether reservations are paid guest stays or non-paid calendar blocks.
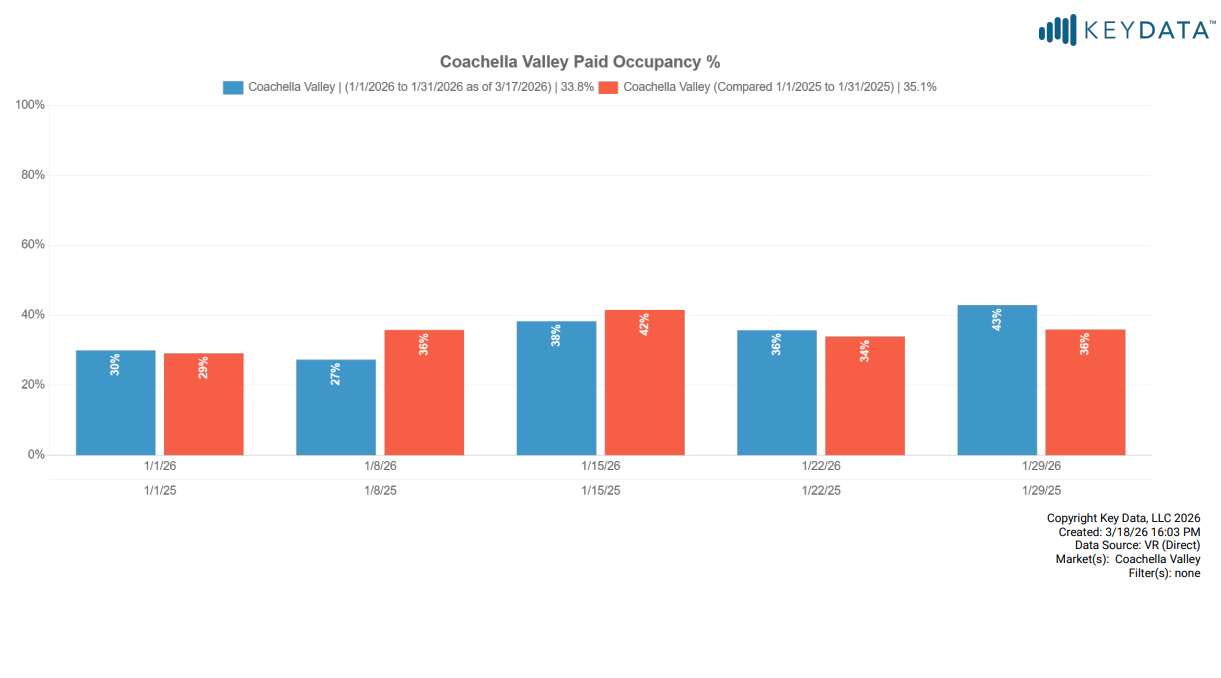
Paid Occupancy – Professionally Managed Homes
For the month of January 2026, paid guest occupancy in vacation rental homes was was 33.8%, down from 35.1% in 2025.
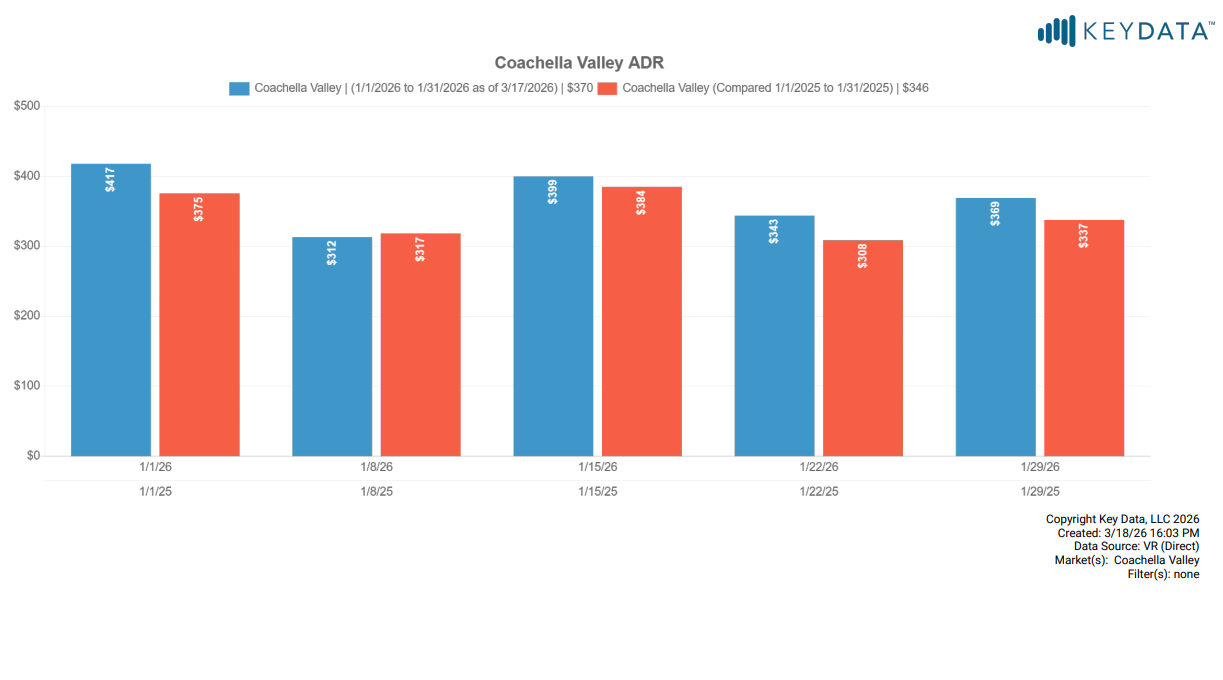
Average Daily Rate (ADR)
ADR for January 2026 was $370, up from $346 in 2025.
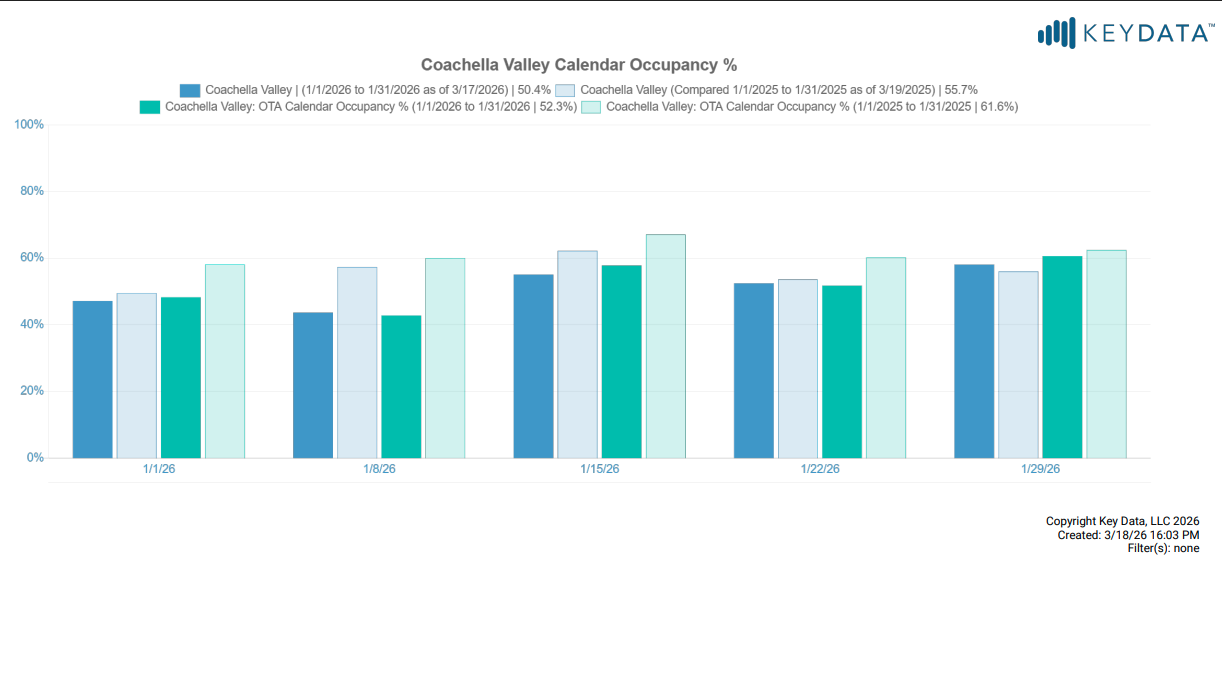
OTA Calendar Occupancy
OTA calendar occupancy was 52.3% for January 2026, compared to 61.6% in 2025. Note, the graph below also includes professionally managed “calendar occupancy” which includes dates occupied by owners, maintenance holds and other non-paid calendar blocks. OTA calendars do not indicate whether reservations are paid guest stays or non-paid calendar blocks.
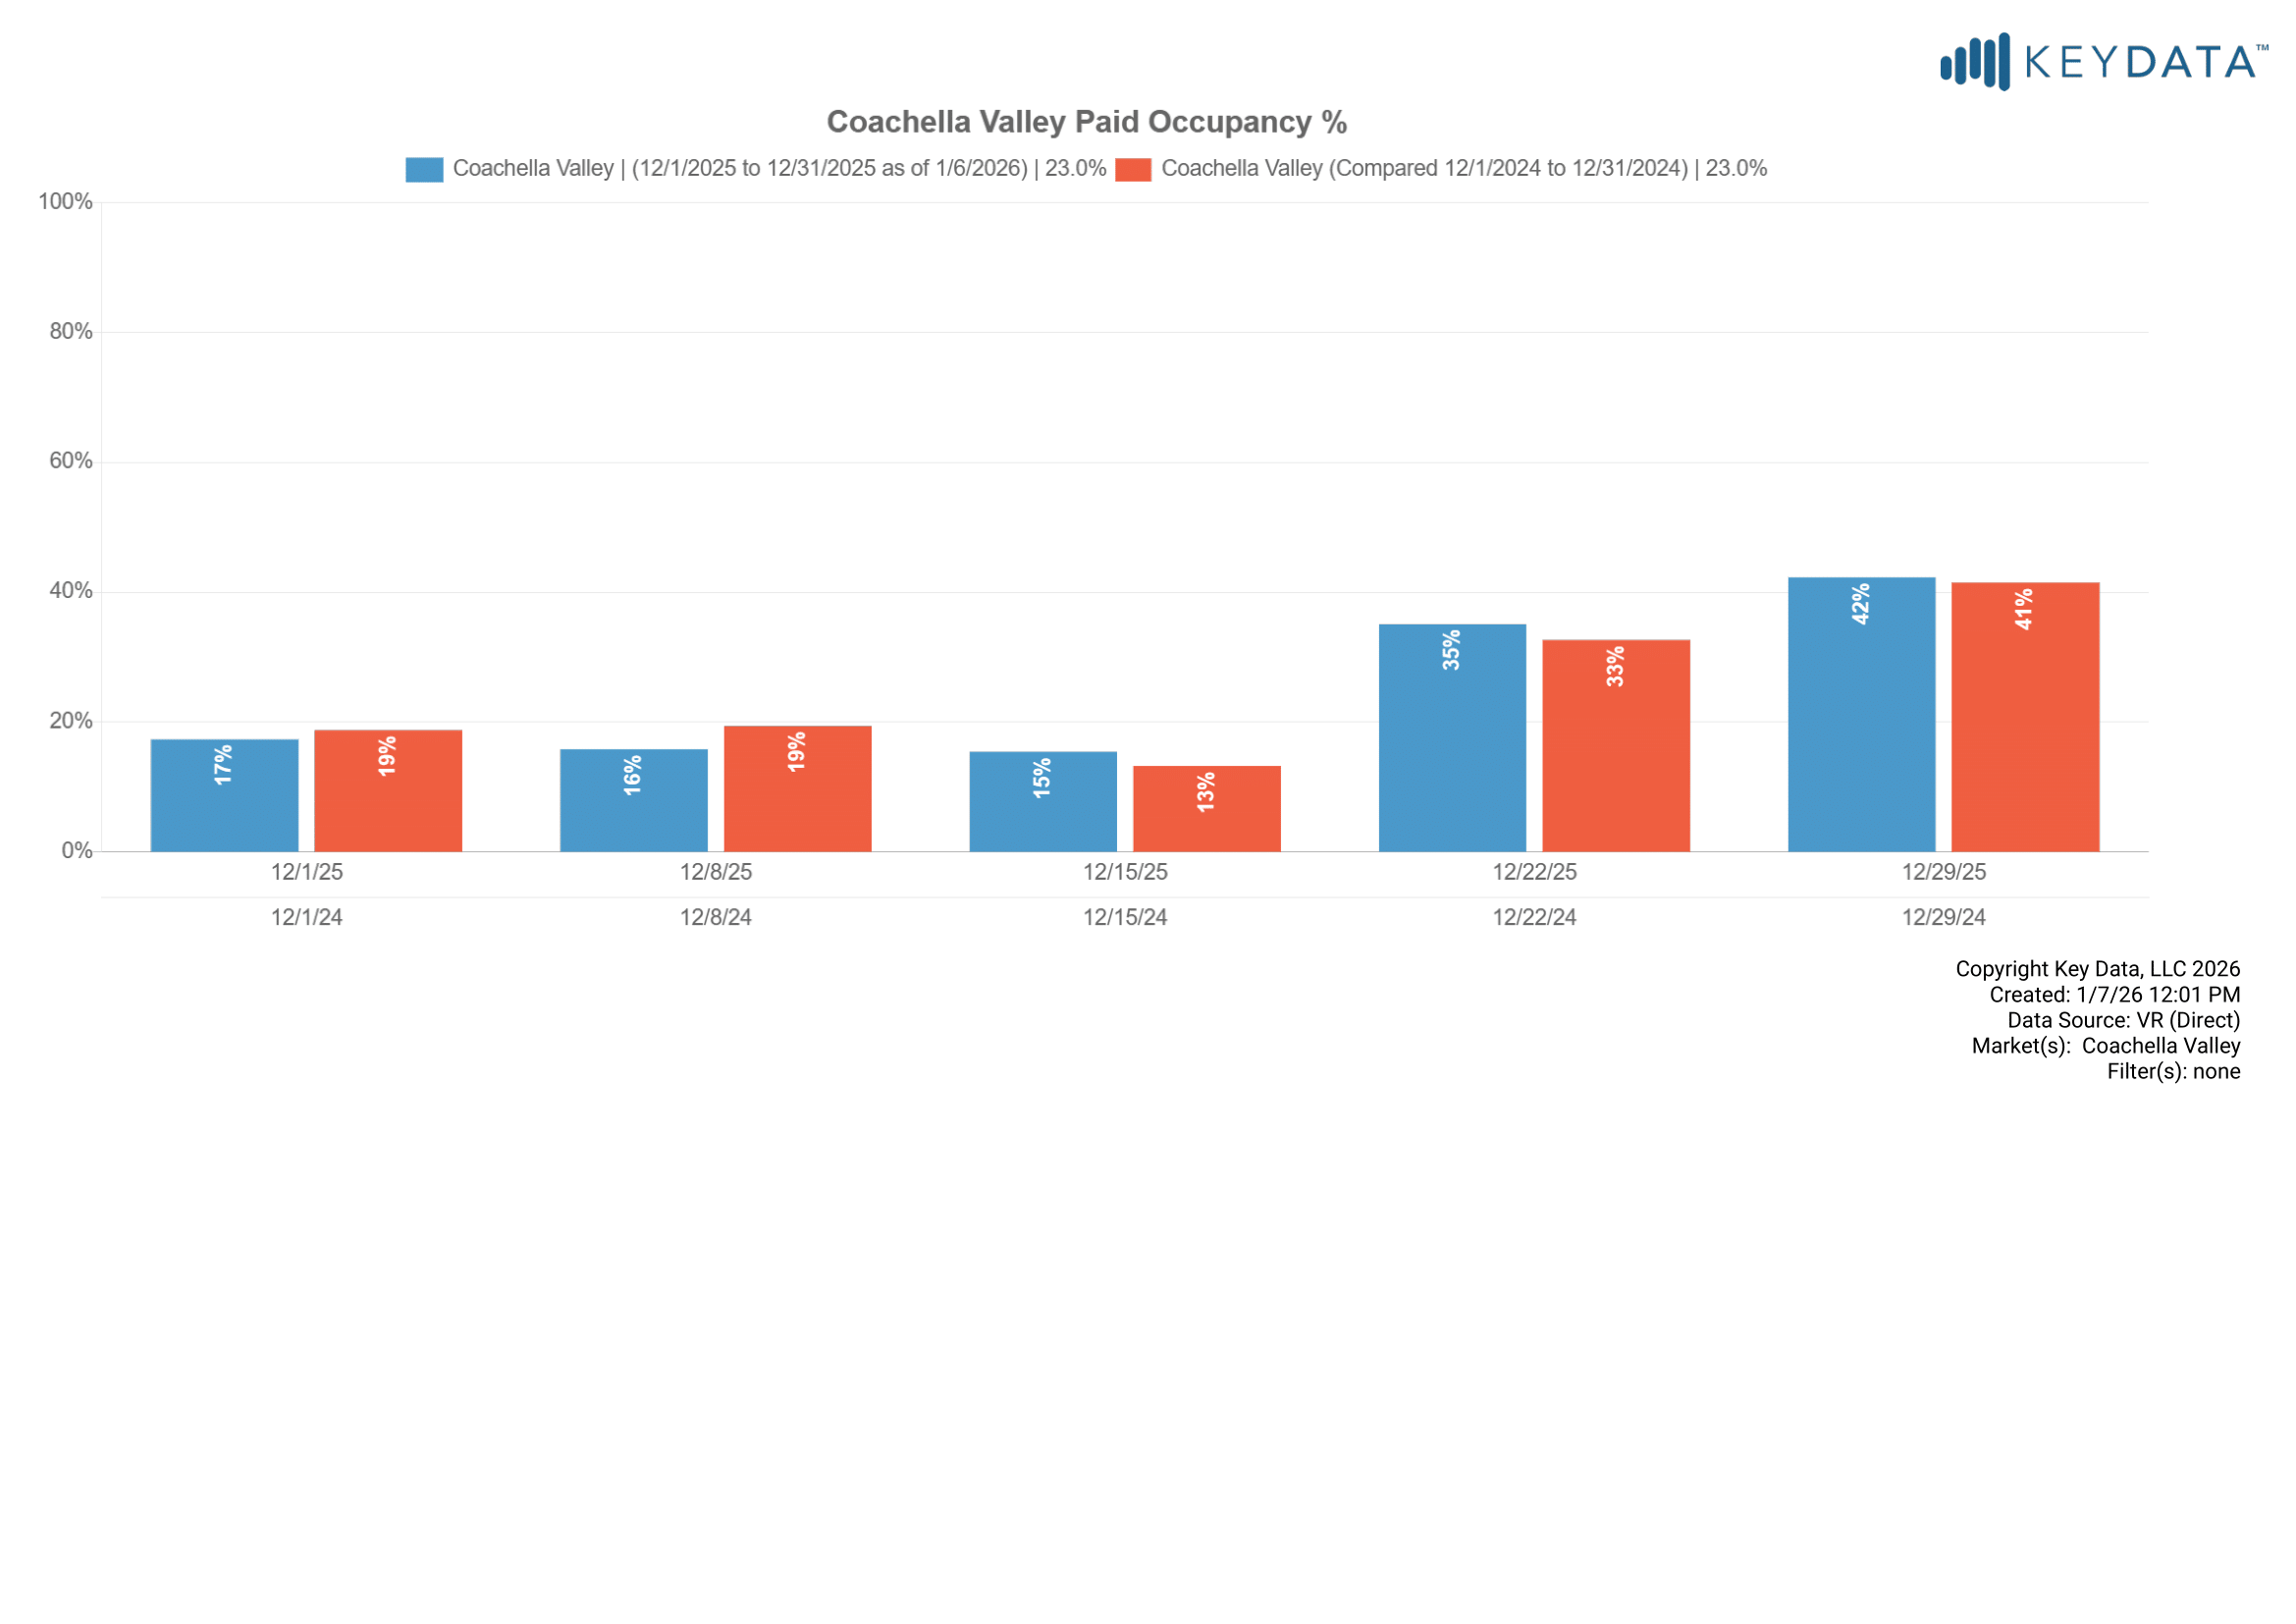
Paid Occupancy – Professionally Managed Homes
For the month of December 2025, paid guest occupancy in vacation rental homes was was 23%, flat year over year compared to 23% in 2024.
Average Daily Rate (ADR)
ADR for December 2025 was $463, up from $412 in 2024.

OTA Calendar Occupancy
OTA calendar occupancy was 47.4% for December 2025, compared to 55.3% in 2024. Note, the graph below also includes professionally managed “calendar occupancy” which includes dates occupied by owners, maintenance holds and other non-paid calendar blocks. OTA calendars do not indicate whether reservations are paid guest stays or non-paid calendar blocks.

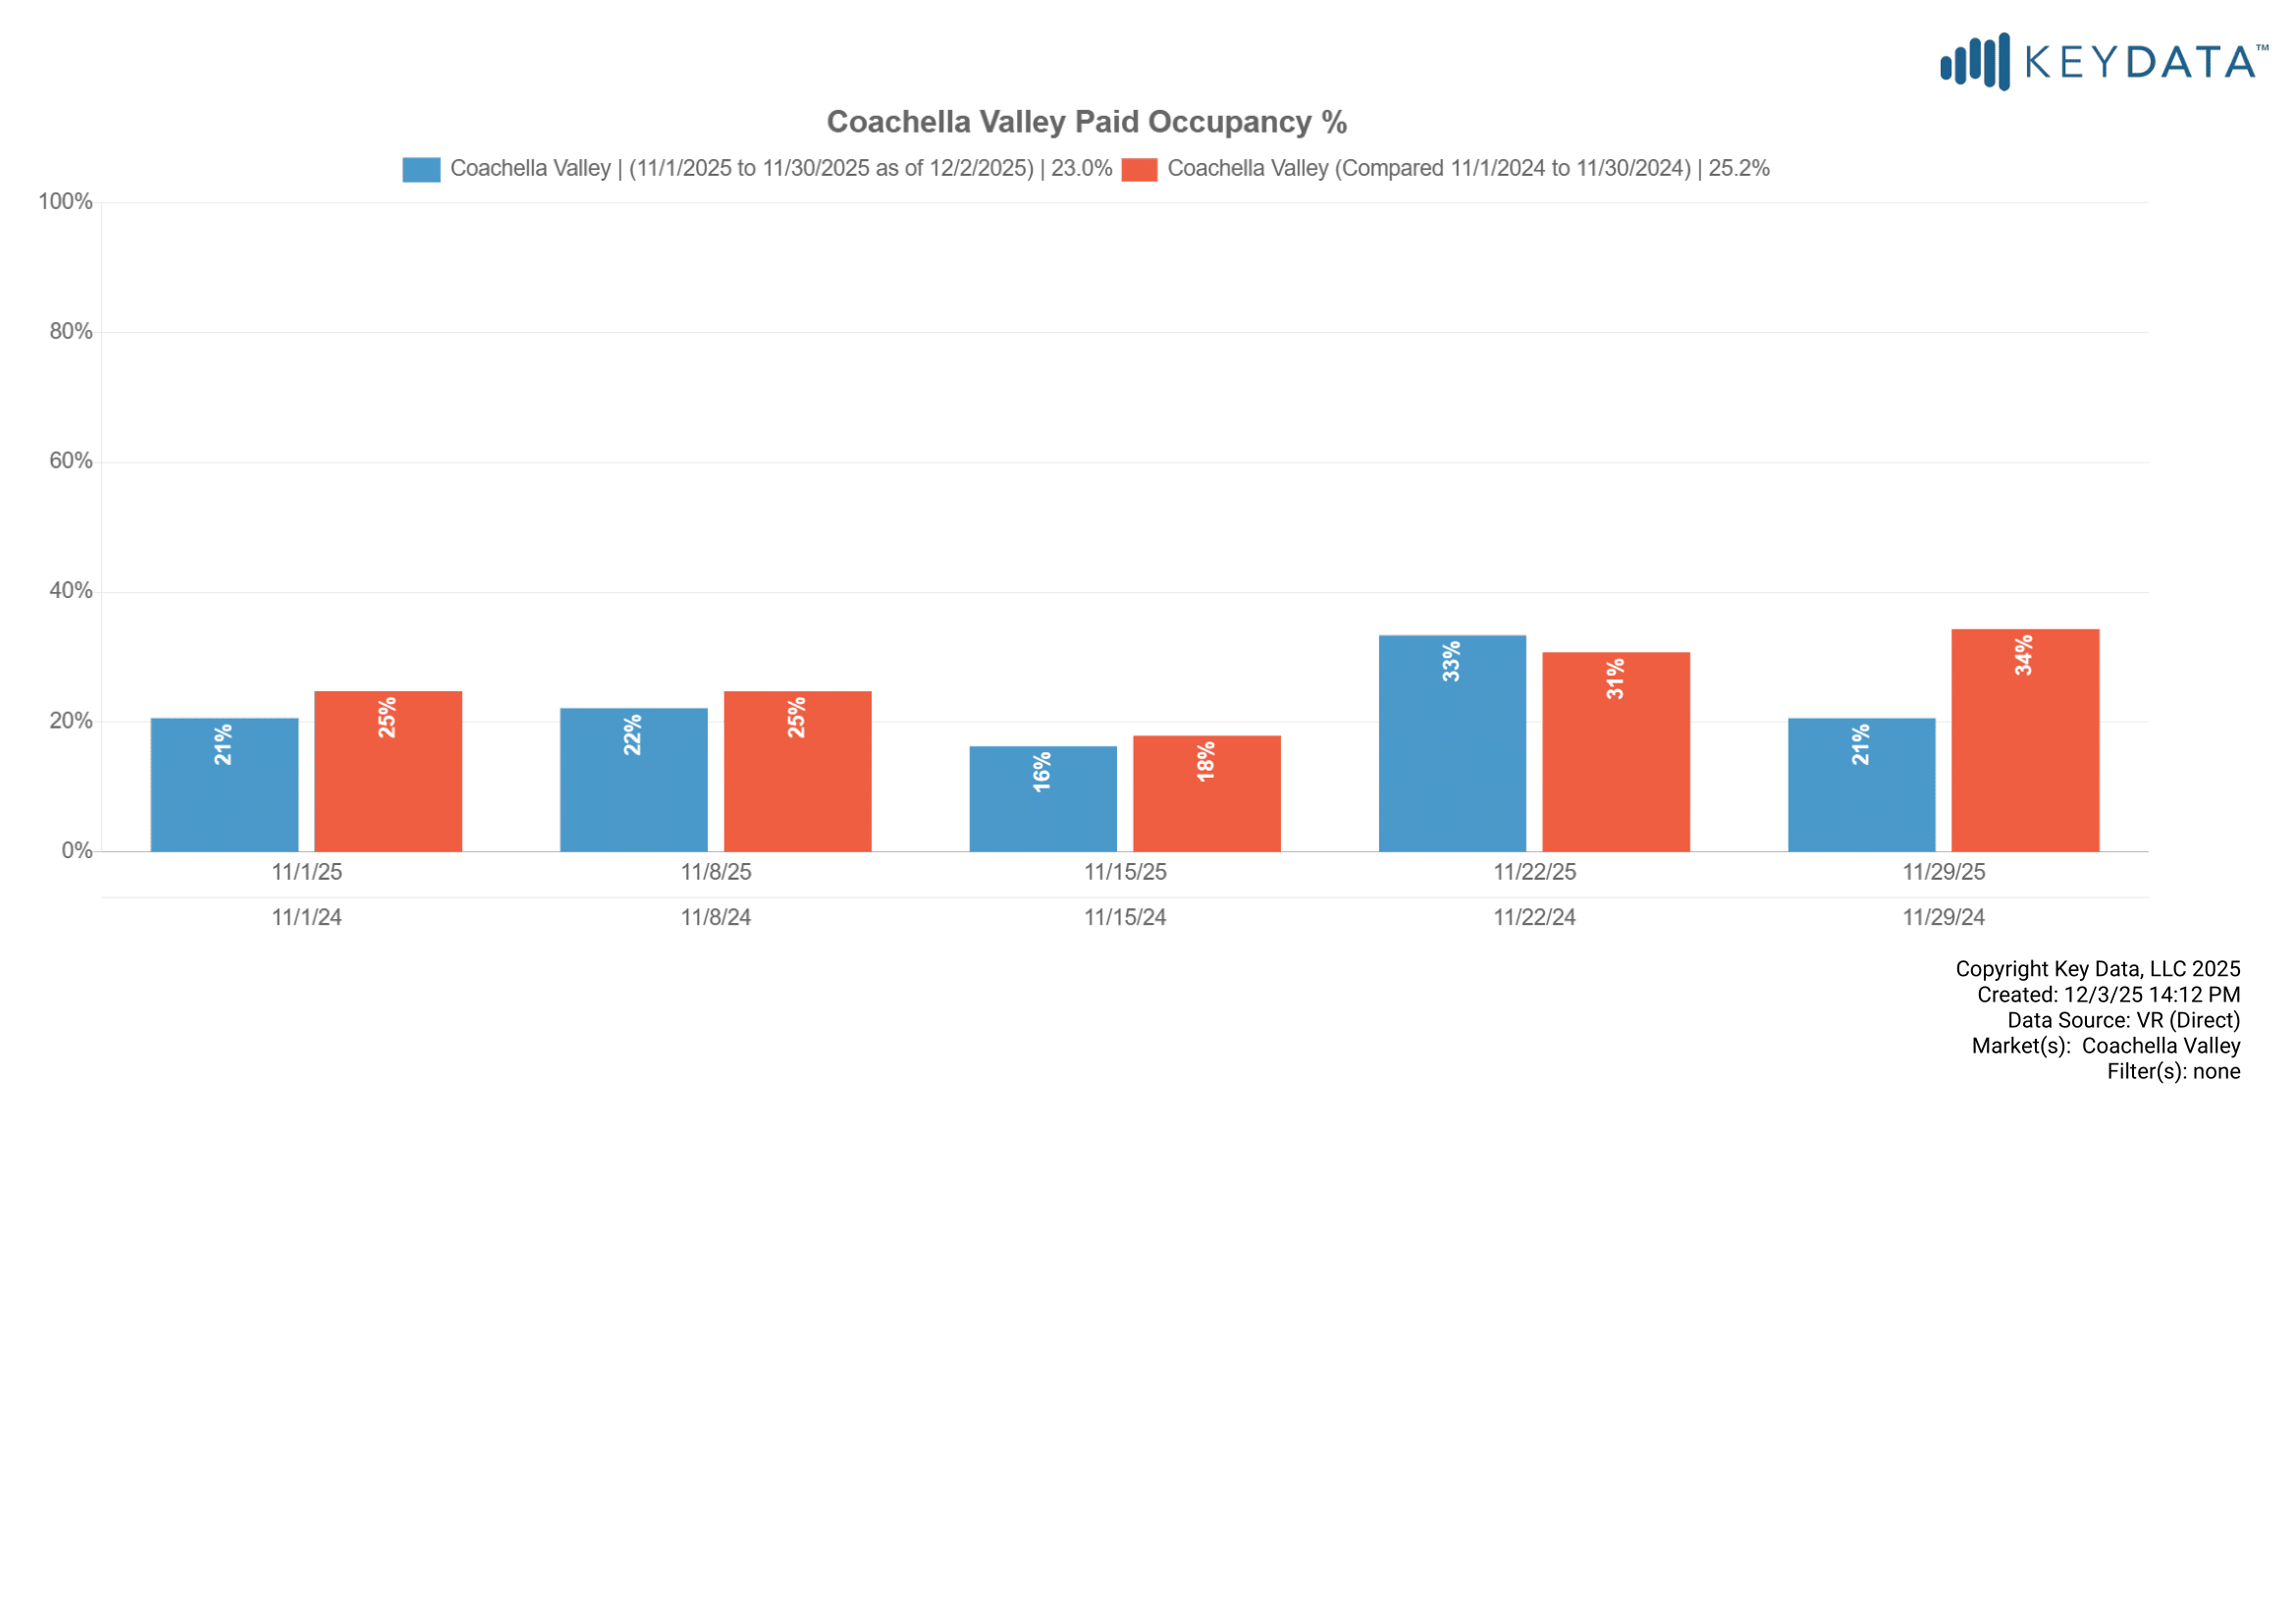
Paid Occupancy – Professionally Managed Homes
For the month of November 2025, paid guest occupancy in vacation rental homes was 23.0% compared to 25.2% in 2024.
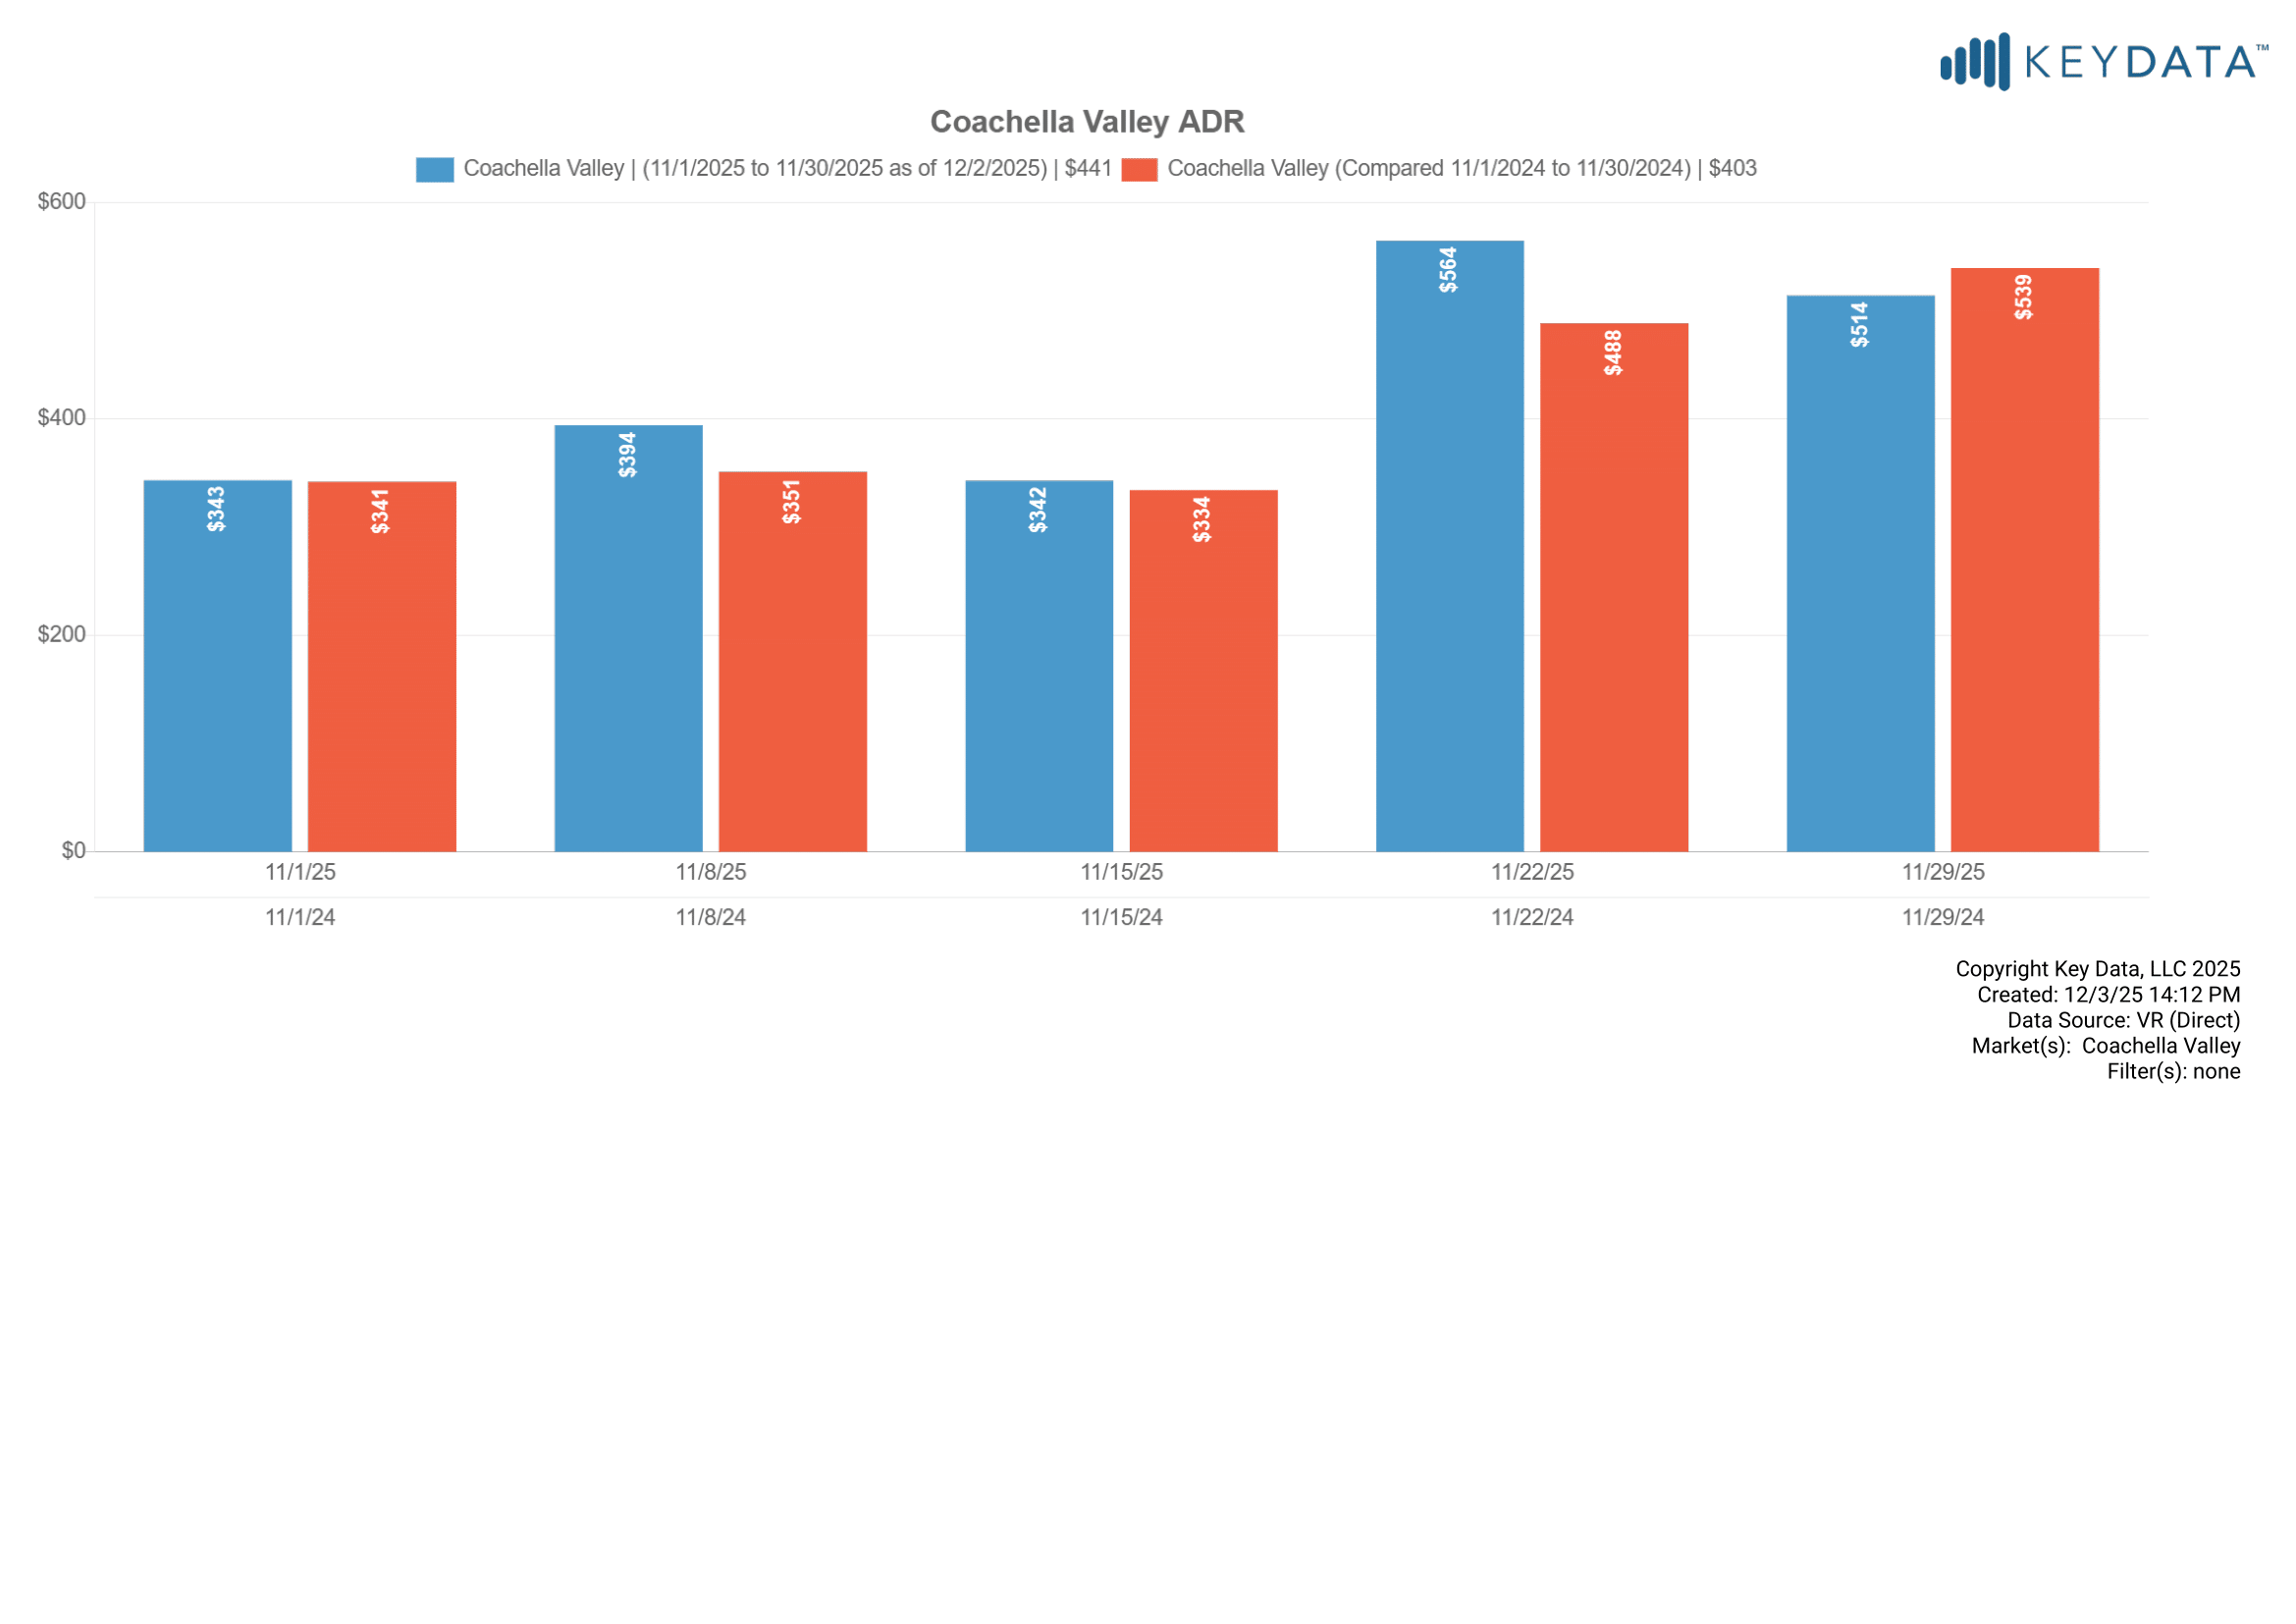
Average Daily Rate (ADR)
ADR for November 2025 was $441, up from $403 in 2024.
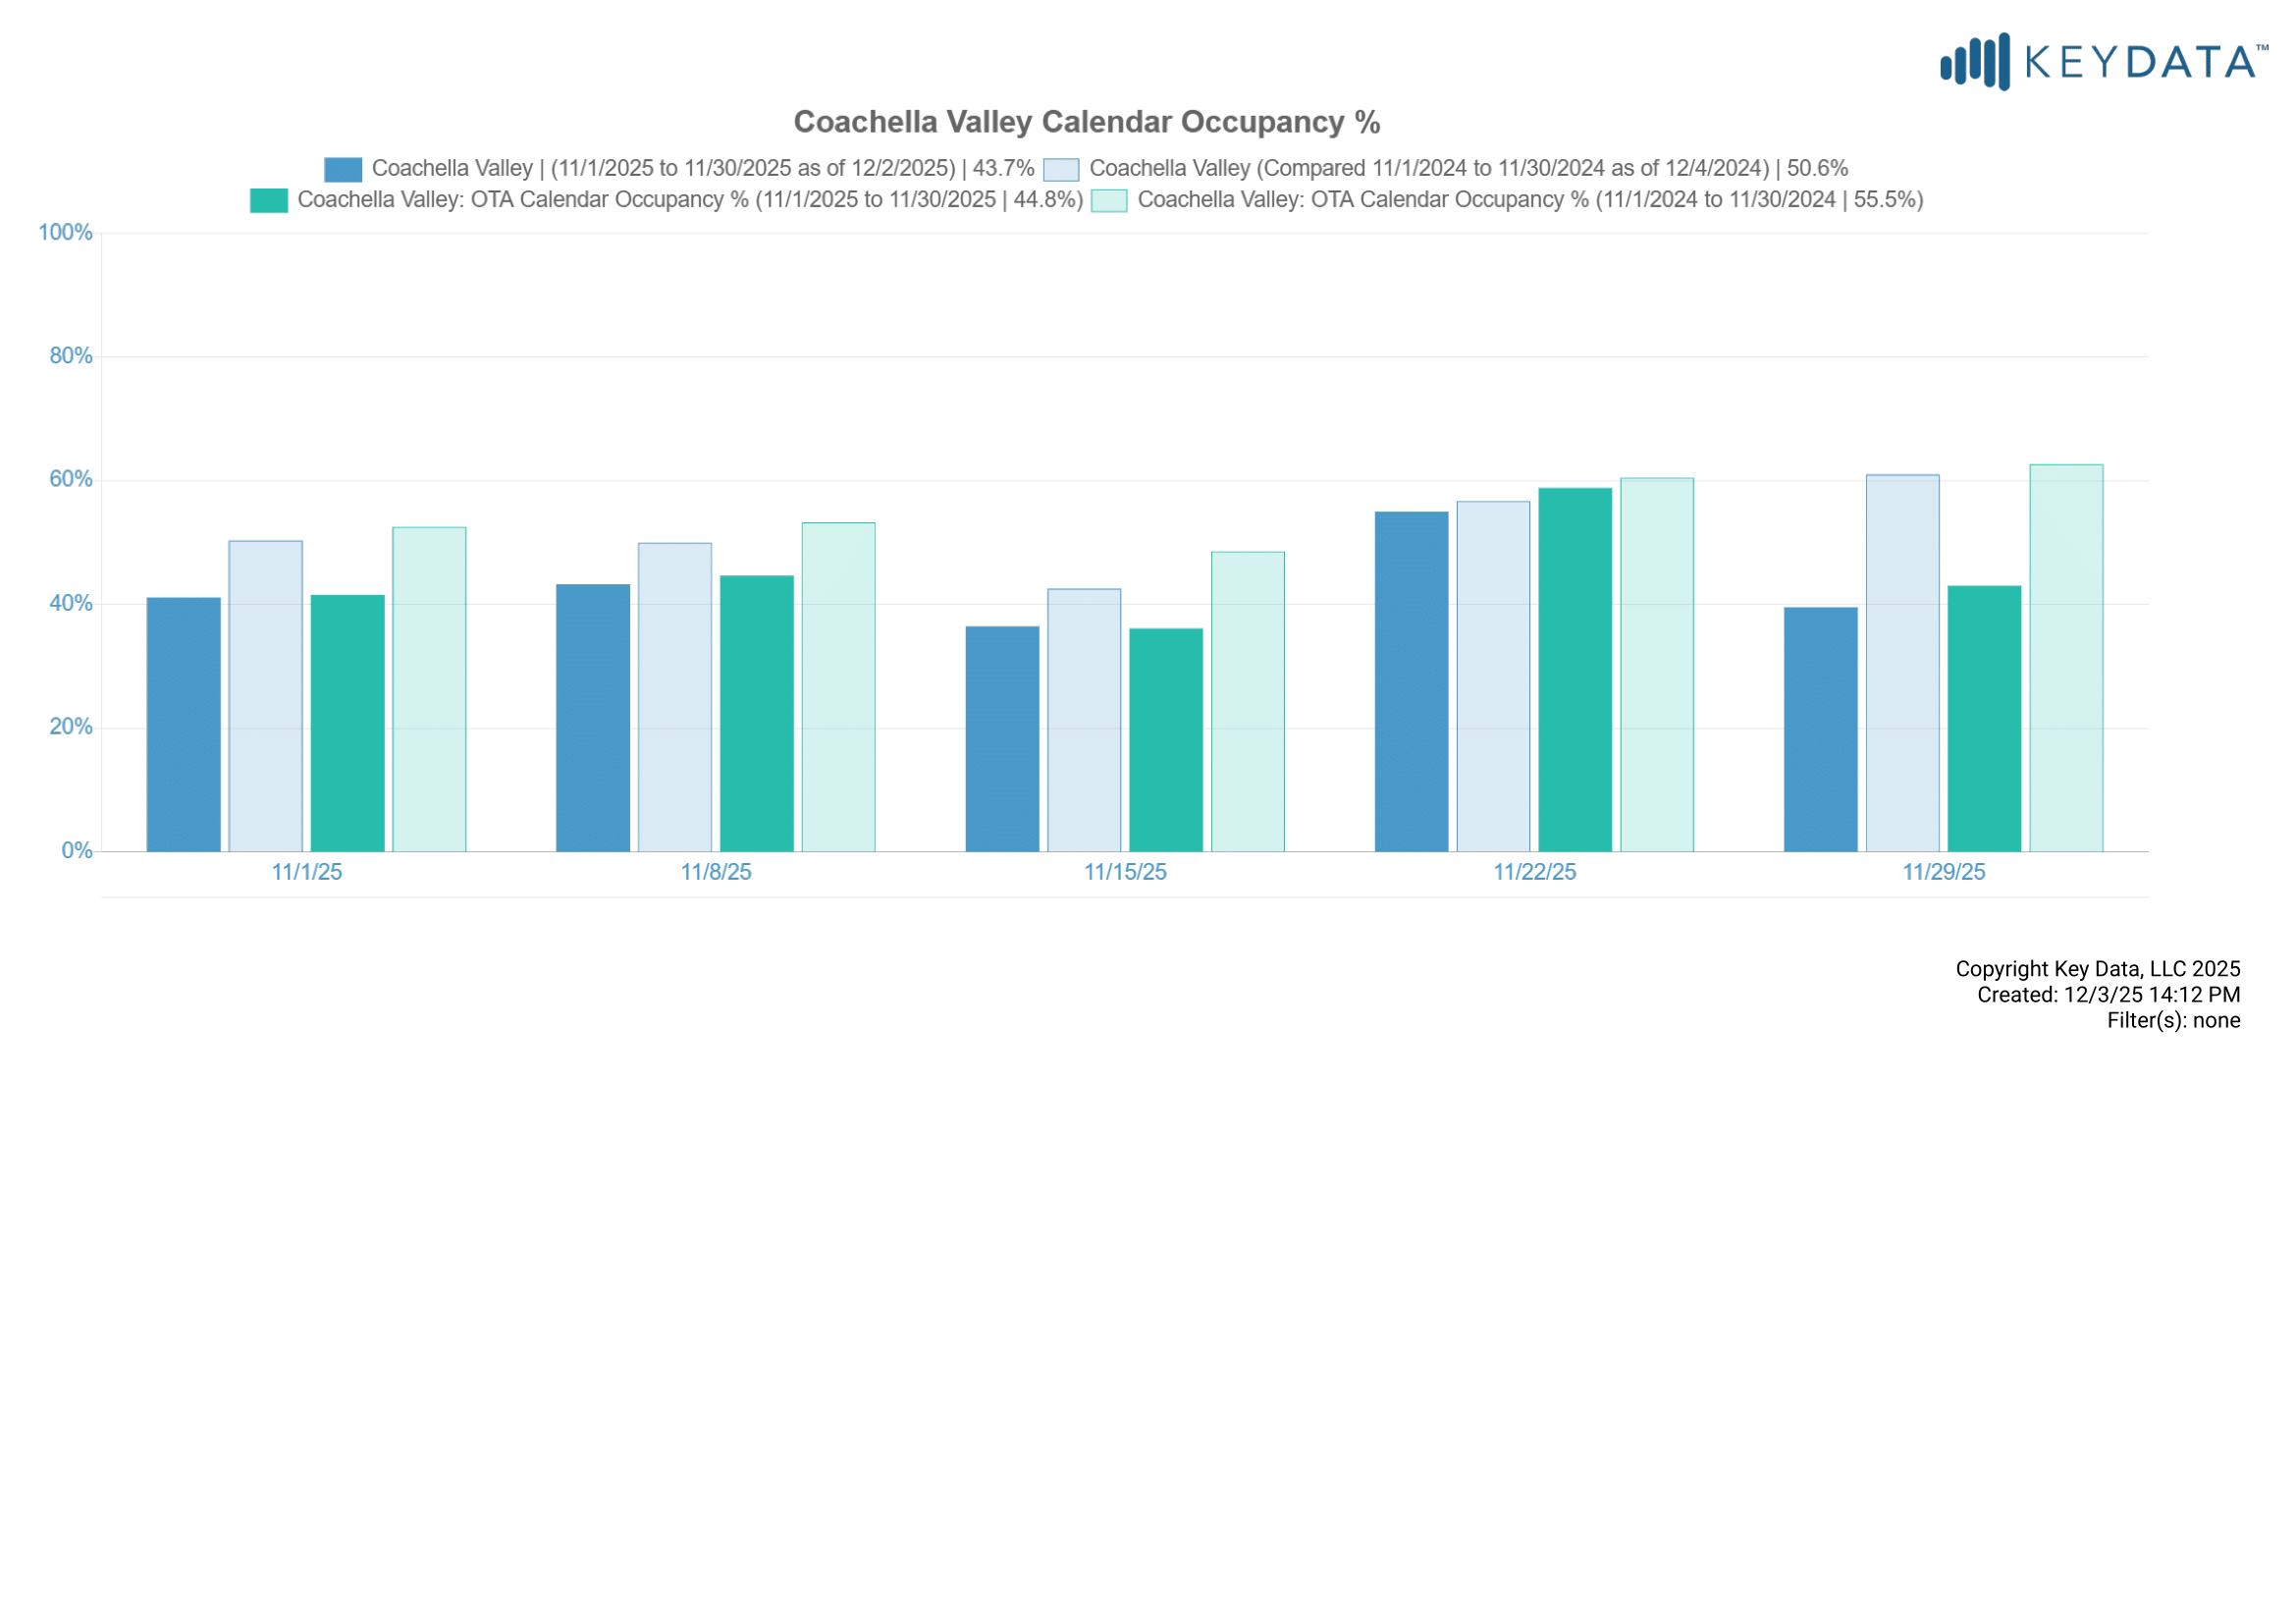
OTA Calendar Occupancy
OTA calendar occupancy was 44.8% for November 2025, compared to 55.5% in 2024. Note, the graph below also includes professionally managed “calendar occupancy” which includes dates occupied by owners, maintenance holds and other non-paid calendar blocks. OTA calendars do not indicate whether reservations are paid guest stays or non-paid calendar blocks.